Pore-Pressure and Wellbore-Stability Prediction for Prevention of Drilling incident
Qualitative Pressure detection
When abnormal pore pressures are not accurately predicted in pre-drill stage or detected in real-time drilling, it may cause serious drilling incidents such as fluid influx to the wellbore, kicks, and even blowouts. Pore pressure analysis mainly includes three aspects, these includes:
1. Pre-drill pore pressure prediction.
- Regional Geology,
- Geophysical –Seismic
2. While drilling (Real time) pore pressure detection
- Drilling Rate
- ‘d’ exponent, Sigma log
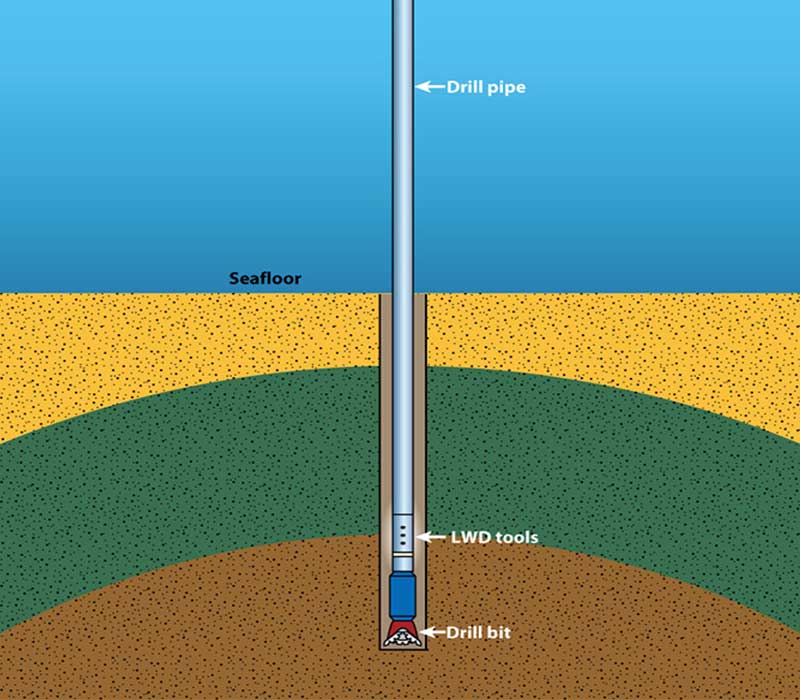
- LWD (Resistivity, Density, Sonic)
- Drag and torque
- Mud pit level, Return flow, Pump Pressure (kick)
- After Lag Time: Gas, (BG, CG, Pump off Gas) MW (out), Cuttings Shape/Size, Lithology (anhydrite, known marker, etc.), Shale density, Shale factor, Temp (out)
3. Post Well pressure Analysis
- Wire Line Logs: Resistivity, Density, Sonic
- Direct Pressure: DST, RFT/MDT
This article will focus on methods of while drilling (real-time) pore pressure detection based on overpressure linked to shale compaction anomaly
Drilling Rate – Rate of Penetration (ROP)
In shale, ROP decreases with depth because of decrease in porosity due to compaction. ROP tends to increase as the bit enters an under-compacted section. ROP depends on: Lithology, Compaction, Differential pressure, WOB (weight on bit), RPM (Rotation per minute), Torque, Hydraulics, Bit Type and Wear.
Factors Affecting ROP
Lithology – Drillability depends on: Porosity, Hardness (Calcareous clays), Plasticity, Abbrasiveness (Accessory minerals, such as siderite), Cohesion
Compaction – Compaction increases with depth. The under-compacted section is indicative of higher porosity. This results in increased drillability.
Differential Pressure – Difference of pressure between mud column and formation pressure. Increase in pressure of mud column decreases penetration rate.
Bit tooth impacts on formation, creating fractures. Further impact deepens the fractures, forming rock fragments.

Overbalance: Rock fragments are difficult to dislodge because of positive differential pressure. Mud Pressure > Formation Pressure
Underbalance: Rock fragments are forced away from formation face. Formation pressure > mud column
Effects of Overbalance:
- Slower rate of penetration
- Formation damage
- Absence or low recovery of hydrocarbons C2-C5 (gas interpretation more difficult)
- Problems for E-log interpretation.
Weight on bit – Changes in WOB affect drill rate; size of bit affects weight applied per unit of surface area
Weight on bit – in an inclined hole, apparent WOB recorded at surface is not representative of down hole WOB. The string may rest on the hole wall, reducing down hole WOB.
Weight on Bit – Generally ROP increases with WOB, up to a ‘flounder point’ which can vary with formation consolidation. (Threshold Weight : minimum weight required to start drilling. Unconsolidated rocks come apart just by jet action, Flounder Point : Drilling rate stops rising. Bit teeth become jammed with cuttings. Bit cleaning is less effective).
RPM – Relationship of RPM and drilling rate for a given formation. Increased RPM increase drilling rate.
Torque – Measurement of torque at surface is effect of bit and string (stabilizers etc.) MWD torque measured at the bottom is probably true indication of bit torque. (Increase in torque is balanced by twisting of the string. This shortens the string. Weight on bit decreases. The torque is released. String lengthens, WOB increases. The process keeps on repeating.
Hydraulics – Effect of hydraulics depends on consolidation of sediments under drilling. Increase in flow rate tends to increase ROP (faster clearing of cuttings from under bit).
Mud properties:
Viscosity: Low viscosity with turbulent flow = more effective cleaning of the bit face.
Water loss: Increased water loss may increase penetration rate by reducing time for mud pressure and pore pressure to reach equilibrium.
Suspended solids: Tend to reduce water loss; may dampen bit impact in some cases.
Bit Type and Wear – most often a consideration when tri-cone rock bits are in use.
- Change of bit type will result in ROP trend change
- Tooth wear may result in gradual ROP decrease that masks transition zone
- Controlled drilling practices may mask transition zone
- Diamond/PDC bits tend NOT to show ROP changes due to wear.
Various methods have been devised to “normalize” the rate of penetration. These attempt to eliminate the effects of drilling parameter variations and thus measure formation drillability. The simplest and most reliable solution is known as ‘d’ Exponent.
‘d’ Exponent
‘d’ Exponent is based on an empirical relationship between drilling rate, weight on bit, rotating speed and bit diameter, first suggested by Bingham (1964):
R/N = a (W/D)d
R = ROP, ft/min
N = RPM
W = WOB, pounds
D = Bit diameter, inches
‘a’ = lithological constant
‘d’ = compaction exponent
Jorden and Shirley (1966) solved for ‘d’ by introducing constants which would allow the use of standard industry units.
Bingham’s constant ‘a’ was assumed to be 1 (constant lithology) and thus is not included.
Original Jordan and Shirley Equation (API):
log ( ROP / 60 RPM )
d = ——————————-
log ( 12WOB / 106BS )
Where:
ROP = ft/hr
WOB = pounds
BS = Bit Size, inches
Original Jordan and Shirley Equation (metric):
1.26 -log ( ROP / RPM )
d = ——————————-
1.58 -log ( WOB / BS )
Where:
ROP = meters / hr
WOB = tonnes
BS = Bit Size, inches
‘d’ Exponent vs. Compaction Trend
Where lithology is constant, ‘d’ Exponent will represent:
- the state of compaction (relative porosity)
- differential pressure
A decrease in ‘d’ while drilling in an argillaceous formation is thus related to the degree of undercompaction and of the associated abnormal pressure.
Note: If measured depth and TVD differ significantly, ‘d’ Exponent should be calculated based on TVD.
Corrected ‘d’ Exponent (dcs)
‘d’ exponent values depend in part on mud density and pore pressure. Any change in differential pressure will thus affect ‘d’ Exponent.
Rehm and McClendon (1971) proposed a correction to account for this effect:
NG
dcs = d ——-
ECD
NG = Normal Hydrostatic gradient – ppg (API) or kg/l (metric)
ECD = Equivalent Circulating Density – ppg (API) or kg/l (metric)
Dcs Bit Wear Correction
When rock bits are in use, the ROP tends to slow down because of tooth wear. The dcs can show a false increase, thus potentially masking a transition zone. Bit wear corrections have been developed to account for this effect.
Dcs Bit Wear Correction
The Galle and Woods Method
1.26 – log [ ( ROP * a P ) / (RPM ) ]
d = ———————————————
1.58 – log (WOB / BS )
a = 0.93 Z2+ 6 Z+ 1
0.31(FBW)2+ 3(FBW) + 1
Z = X * 〔 ———————————– 〕
0.31X2+ 3X + 1
X = (Depth – Initial Depth ) / Bit Run
FBW = final bit wear (initially estimated and later corrected)
P = Tooth wear exponent (.4 to .6 for insert bits, .8 to 1 for tooth bits)
Calculating formation pressure from Dcs
Three methods are commonly used in calculation of pore pressure from Dcs:
1. Equivalent depth method
2. Ratios Method
3. Eaton Method
These are discussed in “Quantitative Methods of Real-Time Pore Pressure and Wellbore Stability Detection”.
Setting ‘d’ Exponent Trend
Trend Line (dcn): line joining dcs points in zones of normal pore pressure.
Formation Pressure is calculated from extent of diversion from normal trend.
- Set the trend in shale only. Select good clean shale section. Avoid silty, calcareous, pyritic shale
- Avoid using trend values where drilling conditions exist that affect ROP, such as balled up bit, pump problem, mud loss zones, coring controlled drilling, etc.
- Upper unconsolidated section should not be considered for trend setting.
- Once trend is set do not change the slope.

To understand the importance of the trend position, you must know that a calculation of the Formation pressure can be made based on the distance between the Dc curve and its normal trend Dcn. Roughly, the Pf curve is a “mirror image” of the distance between Dc and Dcn.

In this case above, we can see that some points of the Pf curve go over the MW curve, but these points correspond to sandy zones, and are not to be considered. Only the red dotted line (passing through the shale points Pf) is important and is used as reference for MW selection.
If the trend is set to the sand reference points (left part of the Dc curve), the formation pressure (Pf) curve is shifted to the left. In this case, the formation pressure will not be calculated accurately and the actual Pf will be over the MW before we can detect it.

Are we sure that a deflection of the Dc corresponds to an overpressure ?
If we have a shale gradually grading to a sand, the Dc will have a deflection towards the left; this can be mistaken for the start of a transition zone. Thus it is important to refer to the lithological column when evaluating the change.
With computerized plotting of Dc, we can introduce a ‘sand line’ cut off to eliminate this effect. Dc values to the left of the cutoff are ignored when pressures are calculated.

If we compare the lithographic column and the Dc, we note that the trends in the shale and in the sand are parallel, there is only a shift. This shows the importance of the cuttings analysis, which is fundamental for the Dc interpretation.
Other drilling parameters for real time pore pressure detection
- Torque increase: The swelling of clay cause a decrease in hole diameter, accumulation of large cuttings or caving on the bit and stabilizers, all these problems are linked to negative differential pressure (MW too low).
- Overpull and drag increase : for the same reason that causes the torque to go up.
- Hole filling increase : Caving may fill the hole during tripping.
- Pit level increase: In case of kick
- Flow output increase : In case of kick
- Pump pressure decrease: In case of kick, the annulus is filled with mud and light fluid (i.e. gas), so the pressure losses in the annulus will be less than with a complete column of mud.
MUD LOGGING LAGGED METHODS OF REAL-TIME PORE PRESSURE DETECTION
Indications from Gas:
- Connection GAS: A good indicator of an increase of pore pressure is the gas “sucked” from the formation during a trip or a pipe connection (by swabbing).

The problem with this method is that it depends on the velocity of the hook when the string is pulled up; two different drillers will give two different pipe connection gases.
A much better system is to check the “Pump off Gas”: the driller stops the pumps without moving the string, so there is no swabbing. But you lose the pressure losses in the annulus; the equivalent mud weight in hole drops from ECD to MW. In that case, a gas show means that the differential pressure is close to being negative.
Check also the gas ratios! If you have more heavy gases (ie C2/C3 is decreasing), you enter a transition zone.
- Background gas and peaks
Check for a. Lithology, b. ROP, c. Flow d. other aspects
- Trip Gas
Check swabbing conditions (overpull, balled up bit, etc )
Swabbing: Produced gas that enters hole because of suction. This can occur due to:
1. High viscosity of mud.
2. Balled up bit.
3. Fast rate of pulling out.
4. Collar size too large for the hole.
5. Swelling of clays
6. Insufficient cutting transport.
Surging: Injection effect – mud is pushed into the formation. This can occur due to fast rate of running in, and other aspects as above.
Gas Composition: Increased proportion of heavier gasses in transition zone may be indicative of abnormal Pressure. High pressure in zone permits expulsion of lighter gasses; heavier gas are retained. Light to heavy gas ratio shows decrease. C2 / C3 ratio is often used for the purpose. C2 / C3 ratio decrease indicates over-pressure.
Gas Cut mud:
Mud gas is an important indicator of the abnormal pore pressure in drilling operations, particularly in shale formations because of lack of good methods to measure the pore pressure in the shale. If large amounts of formation gas flow into the wellbore, the downhole mud weight is reduced because of the nature of low density of gas. This is “gas cut mud,” indicating that the actual density of the mud coming out of the hole is less than the density of the mud being pumped into the hole. If the gas influx is large, the gas cut mud can cause a marked reduction of the downhole mud weight, and this could result in a gas kick or blowout. Therefore, the gas cut mud is an important indicator of the abnormal pore pressure. Intermediate circulation should be given to degas mud.
- INCREASE IN BACK GROUND GAS (BG ) DUE TO CAVING: Gas in isolated pore spaces of shale is under pressure. In trying to escape it forms curved fractures in the shale near wall of hole. The chip then falls in the hole releasing some gas in the process. This leads to increase in BG.
Hydrostatic pressure of mud column < formation pressure: increase in BG due to caving and gas diffusion from low permeability beds (poor quality mud cake)
Variations in differential pressure will affect the gas recovered at surface. Low differential pressure (low overbalance) between mud hydrostatic pressure and formation pressure will give high gas reading while high differential pressure (high overbalance) will give low gas reading.
- Mud Weight : An influx with salted water will make the mud density decrease.
- Mud temperature: The formation temperature gradient will increase in an undercompacted zone. Measuring mud temperature does not give a precise idea of the formation temperature as all actions at surface (new mud, water adding, mixing, trips) will modify the mud temperature. Remember also that the mud has a cooling effect on the bit!
- Mud resistivity: An influx with salted water has a good electrical conductivity and so the resistivity decreases.
Mechanism generating cavings under overpressure conditions
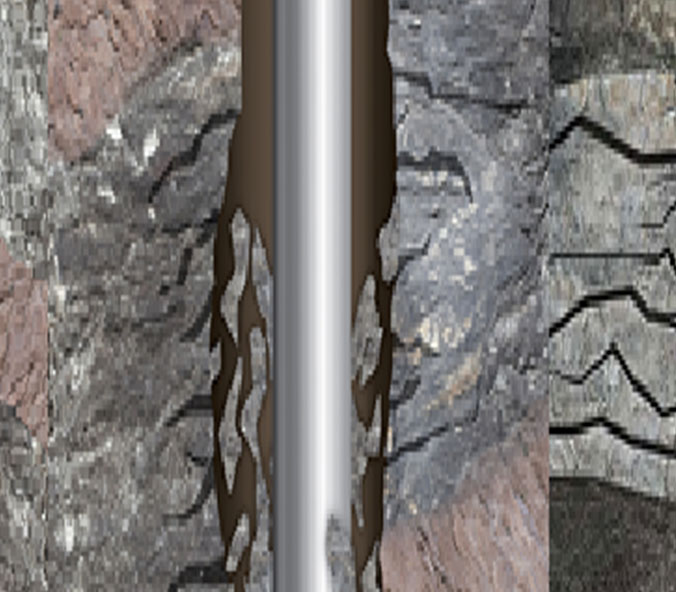
General rule is that the insufficient mud weight produces more and larger cuttings. There are generally four types of cuttings—normal cuttings, cuttings from pre-existing fractures, cuttings owing to underbalanced drilling, and cuttings owing to shear failures.
- Normal Cuttings. If the mud weight is appropriate, that is, higher than pore pressure and collapse pressure but lower than the fracture gradient, the wellbore is in a good condition. In this case, normal cuttings are generated with PDC cutting marks when a PDC bit is used, as shown below

- Cuttings from Pre-existing Fractures. In a formation with preexisting fractures or in a faulted section, the rock may have a lower compressive strength and lower fracture gradient. In this case, it may generate blocky cuttings in which the naturally fractured planes may be observed; therefore, mud losses probably occur in the preexisting fractures.

- Cuttings Owing to Underbalanced Drilling: If the downhole mud weight is less than the formation pore pressure gradient, the wellbore experiences splintering failure or spalling. In this case, spiky and concaved cavings are generalized, as shown in Figure below.

- Cuttings Owing to Shear Failures: Shear failures cause angular or splintered cavings in the wellbore, a case of lower mud weight than the shear failure gradient. as shown below:

Shale density
Plotting shale density (ie using a microsol) versus depth can show an undercompaction. Direct measurement of shale density can be a primary indicator of undercompaction, but several factors limit its usability in the field.
Methods:
1. Variable Density Column: two miscible liquids are mixed to form a column; calibrated with glass beads of different densities.
2. Dense Liquors: series of flasks with fluids of increasing density.
3. Microsol: measurement of cuttings weight in air and weight in water.
4. Mud Balance: measurement of cuttings weight in air and weight in water.
5. Pycnometer: measurement of cuttings weight in air and weight in water.
Limitations of Shale Density
1. Clay must be consolidated for accurate measurement
2. Accessory minerals, carbonate content influence density:
- Given shale density 2.28
- Add water filled porosity 15% + 10% pyrite = Density 2.52
3. Caving -not representative of depth.
4. Water-based mud: smectite group of clays adsorb water from mud.
Thus selection of cuttings is difficult, reducing measurement is not always accurate

Mud losses
Mud losses (indicates that differential pressure is too high). If mud losses or lost circulation is observed, it normally indicates that the applied mud weight is higher than the fracture gradient (excluding mud losses into open fractures or vuggy zones), therefore, it may need to reduce the mud weight. When the hole ballooning (borehole breathing) occurs, it normally indicates that the mud weight is very close to the fracture gradient.
What is Borehole ‘Breathing’?
- The phenomenon of slow mud losses while drilling ahead followed by mud returns after the pumps have been turned off.
- Borehole Breathing is also referred to as ‘ballooning’ or ‘loss/gain’.
What causes Borehole Breathing?
- Generally accepted idea is that the phenomenon of breathing is due to fractures being opened and closed by annular pressure fluctuations resulting from mud circulation and non-circulation. The effect of pressure increase is due to Equivalent Circulating Density (ECD).
- Lowering of the Fracture Gradient due to use of mud coolers may be a cause of breathing.
Why is it important to recognize breathing?
Borehole breathing has often been mistaken in the field for an influx of formation fluid. This can lead to the wrong decisions being made with very costly consequences.
How do you distinguish between ‘Breathing’ and a Formation Influx?
Mud losses while circulating are required for ballooning to occur. Check for small continuous losses while drilling.
LWD / MWD (Shale Resistivity Log)
Resistivity of shale depends on porosity, fluid content and fluid salinity. Under normal compaction and identical environmental conditions, resistivity of shale increases with depth (less fluid content = less conductivity). Thus an abrupt decrease in resistivity is indicative of under-compaction.
Wire line/ LWD conductivity data is generally converted to resistivity. If conductivity plot is available, it will show increased conductivity in an abnormally pressured section.
LWD / MWD (Sonic Transit Time Log)
Sonic transit time is expressed in microseconds per foot.
Interval transit time is given by the equation:
⧍t = ∅⧍t f + (1 – ∅) ⧍tm
Transit time is small in matrix and large in fluid.
Methane= 650
Water = 170 -220
Oil = 238
Quartz = 55.5
For a given lithology transit time will depend on porosity.
Sonic transit time varies with porosity (except when free gas is present). Transit times are faster in the matrix (approx. 40-55 μsec/ft) than in the pore fluids (200 μsec/ft for water). Thus in a transition zone, average transit time will remain steady or increase.
Talk to us for your upcoming Pore-Pressure and Wellbore-Stability Prediction requirement
Geodata Evaluation & Drilling LTD. Pore Pressure consultants use specialist software to provide pore pressure profiles for your wells which are calibrated to offset well behavior for determination of optimum mud weight window for successful drilling operation. Contact us at www.geodatadrilling.com Phone: +234 8037055441


