How to Carryout Primary Well Control While Drilling
Definition of Primary Well Control:
This is the name given to the process that maintains hydrostatic pressure in a well bore greater than the formation fluid pressure but less than fracture pressure.
If hydrostatic pressure is less than formation pressure then unwanted formation fluids will enter the well bore. If the hydrostatic pressure of the fluid in the well bore exceeds the fracture pressure of the formation then the hydrostatic pressure of the fluid in the well bore will decrease possibly to a point where formation pressure will exceed hydrostatic pressure and formation fluids will enter the well bore. An overbalance of hydrostatic over formation pressure is maintained – this is normally referred to as a trip margin.
Secondary Well Control
If the hydrostatic pressure of the fluid in the well bore fails to prevent formation fluids entering the well bore the well will flow uncontrollably until all pressure is dissipated. This process is stopped using a blow-out preventer to prevent the well bore fluids escaping from the well – this is the initial stage of secondary well control – containment of unwanted formation fluids.
For the purpose of this guidance note, we are going to focus on primary well control. However, secondary well control will be discussed in a separate post.
As previously stated Primary Well Control is a process that maintains hydrostatic pressure in a well bore greater than the formation fluid pressure but less than fracture pressure to prevent unwanted fluid entering the wellbore.
What is Hydrostatic, Fracture Pressure and Formation Fluid Pressure?
Hydrostatic Pressure:
The pressure exerted by a column of fluid depends on its density and vertical height or depth. Hydrostatic Pressure (psi) =Mud weight (ppg) x 0.052 (psi/ft) x True Vertical Depth (TVD)ft
Where:
psi = pounds per square inch.
ppg = pounds per gallon.
0.052 = pounds per square inch per vertical foot of a 1 pound per gallon fluid.
Since pressure is measured in Ibs per square inch (psi) and depth is measured in feet, it is convenient to convert mud weight from Ibs per gallon (ppg) to a pressure gradient in psi/ft.
The 0.052 conversion factor is derived as follows: 1 cubic ft. contains 7.48 US gallons. A fluid weighing 1ppg would weigh 7.48Ibs per cubic ft.
The pressure exerted by that one ft. height of fluid over the area of the base would be:
7.48 pounds/144 square inches = 0.0519 pounds per square inch (psi) Hence, a one ft. high column of 1ppg fluid would exert 0.052 psi on its base. This is the same as saying the pressure gradient of the fluid is 0.052 psi/ft.
ppg x 0.052 ( mud weight) = psi/ft. (pressure gradient)
Formation Fracture Pressure
Formation fracture pressure, or formation breakdown pressure is the pressure required to rupture a formation, so that whole mud can flow into it. The symbol PFB is usually used to denote this pressure.
Commonly this is expressed as a pressure gradient, GFB, with the units of psi/ft.
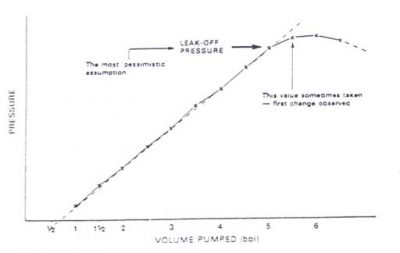
The formation breakdown pressure is usually determined for formations just below a casing shoe by means of a leak-off test (LOT). This test of the formation strength, also known as a formation integrity test or FIT, is effected after the casing has been run and cemented in place. This allows formations to be tested after the minimum of disturbance and damage due to drilling, and allows a clear indication of strength to be determined for one isolated zone.
Leak Off Test (LOT) Procedures and Calculations
- Drill out new formation few feet, circulate bottom up and collect sample to confirm that new formation is drilled to and then pull string into the casing.
- Close annular preventer or pipe rams, line up a pump, normally a cement pump, and circulate through an open choke line to ensure that surface line is fully filled with drilling fluid.
- Stop the pump and close a choke valve.
- Gradually pump small amount of drilling fluid into well with constant pump stroke. Record total pump strokes, drill pipe pressure and casing pressure. Drill pipe pressure and casing pressure will be increased continually while pumping mud in hole. When plot a graph between strokes pumped and pressure, if formation is not broken, a graph will demonstrate straight line relationship. When pressure exceeds formation strength, formation will be broken and let drilling fluid permeate into formation, therefore a trend of drill pipe/casing pressure will deviate from straight line that mean formation is broken and is injected by drilling fluid. We may call pressure when deviated from straight line as leak off test pressure.
- Bleed off pressure and open up the well. Then proceed drilling operation.
Oilfield Unit
Leak Off Test pressure in mud density
Leak off test in equivalent mud weight = (Leak Off Test pressure ÷ 0.052 ÷ Casing Shoe TVD) + (Current Mud Weight)
Where;
Leak off test in equivalent mud weight in ppg
Leak Off Test pressure in psi
Casing Shoe TVD in ft
Current Mud Weight in ppg
Note: Always round down for LOT calculation
Example:
Leak off test pressure = 1,600 psi
Casing shoe TVD = 4,000 ft
Mud weight = 9.2 ppg
Leak off test in equivalent mud weight (ppg) = (1,600 psi ÷ 0.052 ÷ 4,000 ft) + 9.2ppg = 16.8 ppg
Formation Integrity Test (FIT) Procedure and Calculation
Formation Integrity Test is a method to test strength of formation and casing shoe by increasing Bottom Hole Pressure (BHP) to designed pressure. FIT is normally conducted to ensure that formation below a casing shoe will not be broken while drilling the next section with higher BHP or circulating gas influx in a well control situation. Normally, drilling engineers will design how much formation integrity test pressure required for each hole section.
The formula below demonstrates how to calculate required FIT pressure.
Pressure required for FIT = (Required FIT – Current Mud Weight) × 0.052 × True Vertical Depth of shoe
Where:
Pressure required for FIT in psi
Required FIT in ppg
Current Mud Weight in ppg
True Vertical Depth of shoe in ft
Note: FIT pressure must be rounded down.
Example:
Required FIT (ppg) = 14.5
Current mud weight (ppg) = 9.2
Shoe depth TVD (ft) = 4000 TVD
Pressure required for FIT = (14.5-9.2) × 0.052 × 4000 = 1,102 psi
Maximum Allowable Annular Surface Pressure
The leak-off pressure, PLO, is determined as the maximum surface pressure, which the well could stand, with the hydrostatic load of mud in use at the time of the test. This can be described as the Maximum Allowable Annular Surface Pressure (MAASP) with that particular mud weight in use (meantime we shall leave aside safety factors).
Every time the mud weight is changed, the MAASP changes and must be recalculated.
MAASP = (GFB – CMUD) x Shoe Depth, True Vertical
If a Maximum Equivalent Mud WT is quoted for formation strength, then the same formula appears as:
MAASP = (Max Equiv. Mud Wt(ppg) – Current Mud Wt(ppg) x 0.052 x Shoe Depth, True Vertical
Frequently a safety factor is applied so that the ‘actual’ maximum is never applied.
This safety factor gives a margin for error. A leak-off test is not usually a precise or high accuracy test, so a margin, and a value somewhat lower than the formation fracture is used, particularly when the ECD is a major factor.
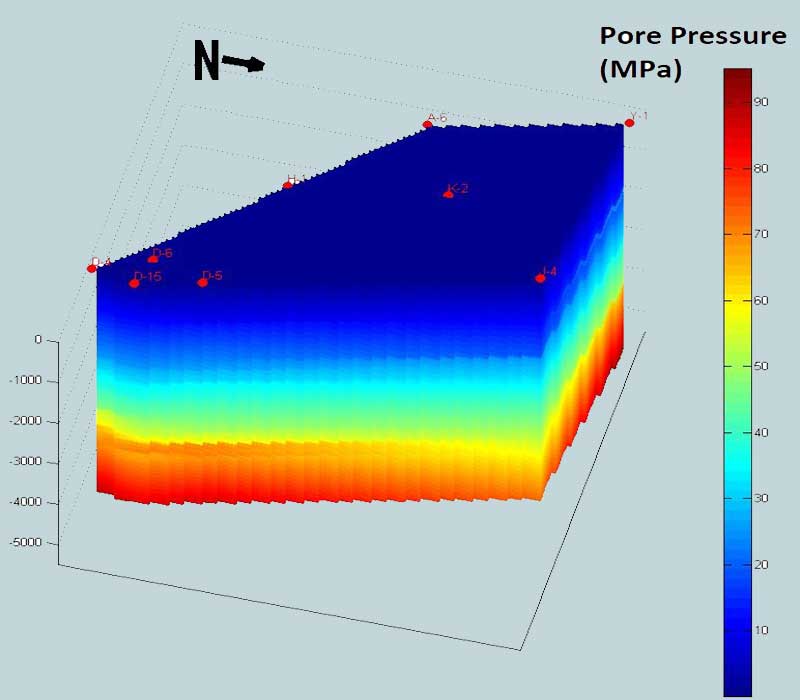
Formation Fluid Pressure (PF)
The formation fluid pressure, or pore pressure, is the pressure exerted by the fluids within the formations being drilled.
The sedimentary rocks, which are of primary importance in the search for, and development of oil fields, contain fluid due to their mode of formation.
Most sedimentary rocks are formed as accumulation of rock debris or organic material, underwater. Since over two thirds of the earth’s surface is covered with oceans, the vast majority of sedimentary rocks are laid down as marine sediments in the shallow seas around the land areas.
In general, areas of the earth’s surface, which are above sea level, are affected by the processes of erosion (breaking up and wearing down of the land masses). The debris is washed down into the shallow sea basins where it settles out onto the sea floor, the coarser material generally settling out closer to the shore than the fine silts and clays.
This process may continue for long periods as the earth’s surface slowly moves, some areas being pushed up to provide fresh surfaces for erosion, with adjacent sea basins slowly deepening to allow great lengths of sediment to build up. Thus sedimentary rocks contain water, usually seawater, as an integral part of their make-up. As the depth of sediment increases, the rocks are compacted, squeezing water out. The water contained within the rocks becomes progressively more salty as the relatively small molecules of water move through the pore spaces of the rock, while the larger salt molecule is retained.
The result of this is that the formation fluid pressure, or pore pressure, exerted by the water in a normal, open, sedimentary sequence is equivalent to that produced by a free-standing column of salt water, which is rather saltier and heavier than typical sea water.
An average figure for normal formation pressure gradient in marine basin sediment determined some years ago in the US Gulf Coast area is 0.465 psi/ft. This is the pressure gradient produced by a column of water of approximately 100,000 ppm chloride. In comparison, a typical value for seawater is 23,000 pprn chloride.
This gradient of 0.465 psi/ft. or expressed as an equivalent mud weight, 8.94 ppg is generally accepted as a representative figure for normal pore pressures in marine basins in the Gulf of Mexico. a common value for the North Sea is 0.452 psi/ft.
Abnormal Pressures
Abnormal formation fluid pressure, or ‘sur-pressures’ as they are sometimes known, are pressures greater than normal formation pressure and can rise for a number of reasons. They can be categorized as:
- Under compaction
- Artesian Effect
- Faulting
- Salt Dome
- Gas Cap Effect
- Charged Sand
The above causes of Abnormal Pressure will be discussed in another post
As discussed previously, Primary Well Control is a process that maintains hydrostatic pressure in a well bore greater than the formation fluid pressure but less than fracture pressure to prevent influx of formation fluid to the wellbore.
Definition of Influx and Kick
An influx is an intrusion of unwanted formation fluids into the well bore which does not immediately cause formation pressure to exceed the hydrostatic pressure of the fluid in the well bore – but may do if not immediately recognized as an influx – particularly if the formation fluid is gas. A kick is an intrusion of unwanted fluids into the well bore such that the formation fluid pressure exceeds the effective hydrostatic pressure of the well bore fluid.
There are some warning signs to watch out for while drilling to ensure drilling mud weight (hydrostatic pressure of the well) is adjusted to mitigate formation fluid influx to the wellbore.
Kick or Influx Warning Signs
DURING TRIPPING
The indication of the presence of a kick or influx is:
- Incorrect hold fill volume
If this sign is not noticed at an early stage, it should become progressively more obvious. In the more extreme case the hole would eventually stay full, or flow, while pulling out.
- Hole keeps flowing between stands, while running in
The presence of some or all of these indications requires that a flow check is carried out to determine whether or not a kick is in progress.
DURING OR AFTER TRIPPING
Trip gas is a measure of swabbed gas over an entire trip. Often a short trip of 15-20 stands is made in order to circulate bottoms up and measure units of swabbed gas. Excessive units of trip gas may indicate the need for increasing the trip margin and/or reducing swab pressure.
DURING DRILLING
The general definition of a warning sign – particularly while drilling is:
‘It is a sign to indicate a kick or some other reason’
However, vigilance and care are exercised to ensure that the reason for the sign is investigated.
The following warning signs are given in approximate order of priority. The drilling break is considered the most important and must always be investigated.
Drilling Break
A sudden increase in rate of penetration is usually caused by a change in formation type. It may however signal an increase in permeability and an increase in formation pressure. Both these effects result in faster drilling.
The drilling break may be dramatic, though most commonly a gradual change is seen. A drilling break could indicate a kick is in progress though it is often a sign that conditions are changing and formation pressure rising, which may lead to a kick.
Gas-Cut Mud
The appearance of gas cut mud at the surface usually causes concern, particularly bottoms up after a connections The reduction of bottom hole pressure owning to gas cutting can be critical on surface hole. However, due to the compressibility of gas, a fifty percent gas cut of mud at the surface changes the bottom hole pressure at 20,000 feet may be only 100 psi. The relative decrease in surface hole would be critical and the gas must be eradicated.
Gas cutting must not be ignored and the cause must be investigated.
Pump Pressure Decrease/Pump Stroke increase
Invading formation fluid generally reduces the total head of fluid in the annulus. The head of mud in the drill pipe is unaffected, so that there is a tendency for fluid to ‘U- tube’. This means that the pump does not have to provide so much energy and this may be seen as a pump pressured reduction. Depending on the rig installation, a small increase in pump rate may also be noted.
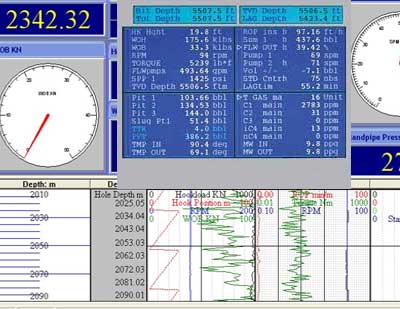
The effect is small, and may not be noticeable. The same effects are seen if a washout occurs, so it is necessary to confirm which is taken place, by doing a flow check. The presence of a continuous recording rnonitor of pump pressure and pump stroke rate on the drill floor means that quite small changes can be seen readily by the Driller.
Total Gas Levels
A gas detector, or hot wire device, provides valuable information. Such instruments measure changes in the relative amounts of gas in the mud and cuttings, but do not provide a quantitative value. Increase in the gas content can mean an increase in gas content of the formation being drilled, gas from cuttings and/ or an underbalanced pressure condition.
In conditions of normal pressure and normal overbalance, background gas should not vary significantly as the hole is drilled. Changes in background levels indicate possible conditions of concern. Increases in the normal background gas indicate the flow of formation gas into the mud or the presence of gas expanding from drilled cuttings. Background gas could mask connection gas, care must be exercised, especially top hole drilling.
Connection gas is a measure of gas which enters the hole whilst making a connections It is reported in units of gas over normal background gas. Estimating the time to pump mud from bottom and checking the gas detector recording can identify connection gas. After the swabbed gas passes the detector, the units should return to the background levels. If not, an underbalance condition could exist.
Connection gas can be eliminated if a sufficiently high overbalance exists, or if pulling speed is reduced and/or if mud properties are adjusted. However, connection gas can be used as an accurate indicator of formation pressure when drilling with close to a balanced pressure. Increasing levels of connection gas are a reliable warning of an underbalanced pressure condition. The relationship of normal gas content readings to the amount of increase can be used as an indicator of the need to increase mud density.
Change in Flow Properties
The presence of formation, such as hydrogen sulphide will effect the chemical and flow properties of mud. Gas and air will ‘froth’ or foam the mud at the surface, lowering the surface density and sometimes increasing the viscosity of the mud.
Formation fluids, particularly salt mater, which can enter the well bore, can also alter the chemical balance of the mud as well as reduce the density. The result can be a drastic change in chemical and flow properties of the mud. For example, salt water in the mud will cause a drop in pH as will hydrogen sulphide with a consequent increase in viscosity and fluid loss.
Sometimes the changing flow properties of a mud system can be a readable warning signal that the well is underbalanced and a kick is imminent.
Torque and Drag, Fill on Connections
Increases in torque and drag often occur when drilling underbalance through some shale intervals. As the result of this fluid in the shale expands, causing cracking, spalling and sloughing of the shales into the well bore. This condition can cause a build-up of cuttings in the annulus, excessive fill on connections and trips, a build-up in torque and drag and eventually stuck pipe. Increases in torque and drag can be a good indicator of abnormal pressure, especially if used with other indicators.
Drilling Exponent
Plots of drilling rate versus depth are often difficult to interpret because of changes in drilling rate variables such as WOB, RPM and mud properties. In 1986, Jorden and Shirley developed a normalized rate of penetration equation from data gathered on the Gulf Coast. In their relationship, normalized drilling rate was defined as a function of measured drilling rate, bit weight and size and rotary speed in the equation shown below:
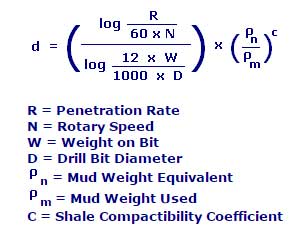
The authors provided correlation of field measured pressure data and ‘d’ exponent calculation. They showed that formation pressure could be estimated by first plotting ‘d’ values in shale versus depth, on semilog paper, and determining a normal trend line of decreasing value with depth in the normally pressured section. Then, by determining the differences between the extrapolated values of ‘d’ exponent and those calculated from actual data, the correlation was used to estimate the amount of overpressure at any depth.
The method developed with Gulf Coast data has been applied world-wide with moderate success. Since their original work, others have applied a correction for mud weight to obtain a modified drilling exponent. This is applied in much the same way as the ‘d’ exponent and sometimes it is plotted as 100/d versus depth, for direct comparison with plots of interval transit time.
Shale Density/Cuttings
The examination of shale cuttings and/or cores can provide information on formation pressures. Properties of shale such as bulk density, shale type, size, and shape can be related to abnormal pressures.
Several techniques, such as the graduated density column method or the mud balance method, are available to measure the density of shale cuttings recovered at the shaker. Care must be exercised to separate bottom cuttings from upper hole cavings. Also, cuttings must be properly washed and/or scraped to remove the outer layer of mud contaminated sample. Plots of shale bulk density versus depth are made and the normal trend of increasing density versus depth established. Changes from the normal trend can then be related to changes in formation fluid content, and hence formation fluid pressure.
Shale cuttings, which are drilled underbalanced, tend to produce larger than normal cuttings, larger volumes than normal, and shapes that are more angular, sharp and splintery in appearance. These effects are due in part to the fact that fluid trapped within pores of the shale at high pressure expands when exposed to the lower mud hydrostatic pressure. Therefore, drilling rates and hold size increases as shale continues to expand, crack, spall and slough into the well bore, thereby creating larger and different shaped cuttings or cavings. Volume of cuttings increases due to faster penetration rates and increased hole volume caused by sloughing and caving. Close observation of shale on the shaker along with other indicators can provide a basis for determining an underbalanced condition prior to taking a kick.
Heaving Shales
Excessive volumes of shale cuttings on the shaker may be an indication of an underbalanced condition. Shale is usually porous, but has little or no permeability. Fluids in the pores are subjected to formation pressure, but are not able to flow. However, if a differential pressure exists from the formation to the well bore, such as in the case of abnormal pressure, the fluid pressure causes weakening of the walls of the hole and spalling or heaving of shale into the hole. At the surface an increase in volume of shale cuttings is noted. These cuttings are splintery, angular, and generally larger than normal. If these conditions persist, the mud hydrostatic pressure is probably too low and a kick will occur white drilling the next permeable formation.
Shale Type
The type of clay mineral of which shales are largely composed varies slowly with increasing depth and the swelling clays, sometimes known as ‘gumbos’, progressively give way to the non-swelling type. Near the surface the principal clay minerals are calcium and sodium based montmorillonites and illites. With increasing depth of burial these alter slowly – towards the largely potassium based kaolinites.
This change can be determined roughly in a number of ways, as of which the Methylene Blue test for clay absorption lever determination, and Differential Thermal Analysis for structural water content determination are the best known and most widely used.
Flow line Temperature
The temperature gradient in the transition between normal and abnormal pressure zones often increases to about twice the rate of the normal temperature gradient. Increases of the mud temperature at the surface can also indicate the top of an overpressure section. Consideration must be given to circulation times, trip times, connection times, stabiliser temperature after tripping temperature of mud at suction pit, and other factors such is water depth. An increase in flow line temperature when used with other indicators can show the top of an overpressure section with accuracy.
It is important to note this indicator can be partially or totally masked in offshore drilling from floating vessels by the cooling effect of long lengths of riser and substantial air gaps.
Talk to us for your upcoming Mud logging project for monitoring kick Indicators while drilling
Geodata Evaluation & Drilling Limited offers Mud logging services to Oil and Gas industries. Let us handle the project for you. contact us at www.geodatadrilling.com Phone: +234 8037055441